PORTFOLIO
On this page are listed some Data Visualization Work examples.
If you have further queries about any of the work on this page please feel free to get in touch.
HEADING ON
Visualization of Vehicle Data
Exploratory Data Analysis using Tableau 10 Desktop

HEADING ON is a Startup looking to revolutionise how we use and collect vehicle data. Seven Symbols were tasked with looking into a number of data sets provided by HEADING ON to identify key metrics that verify the company’s strategy and goals.
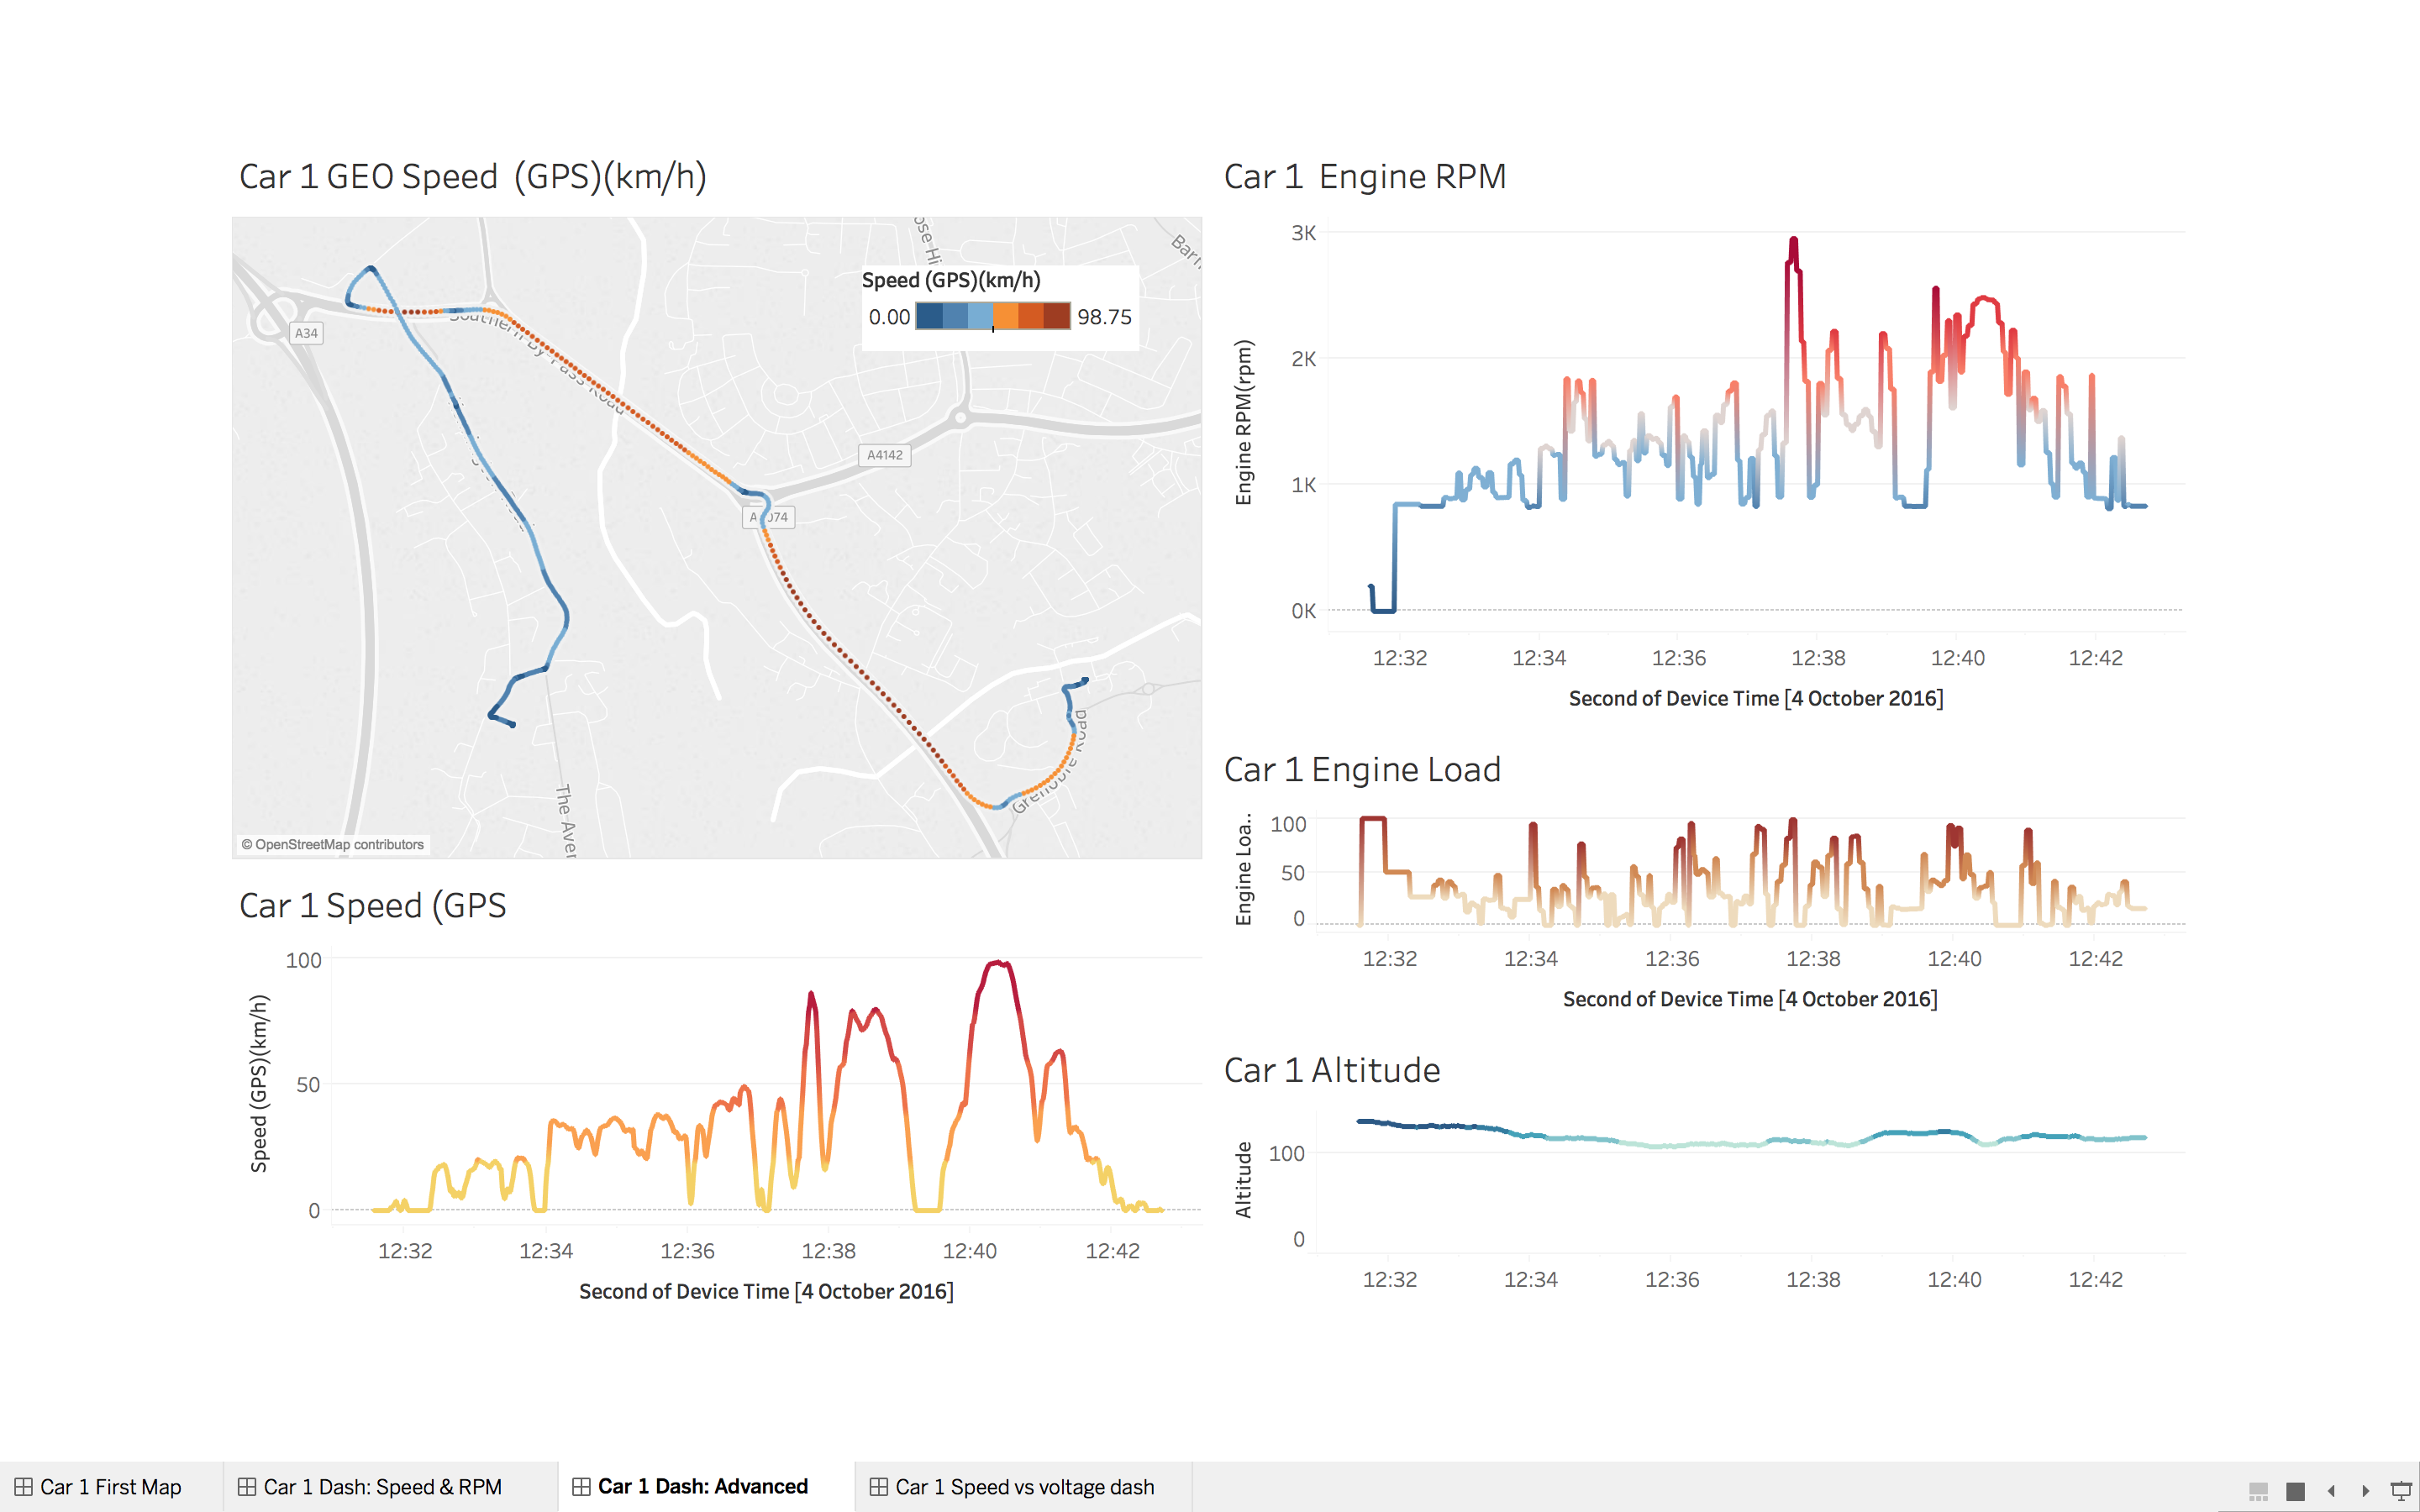
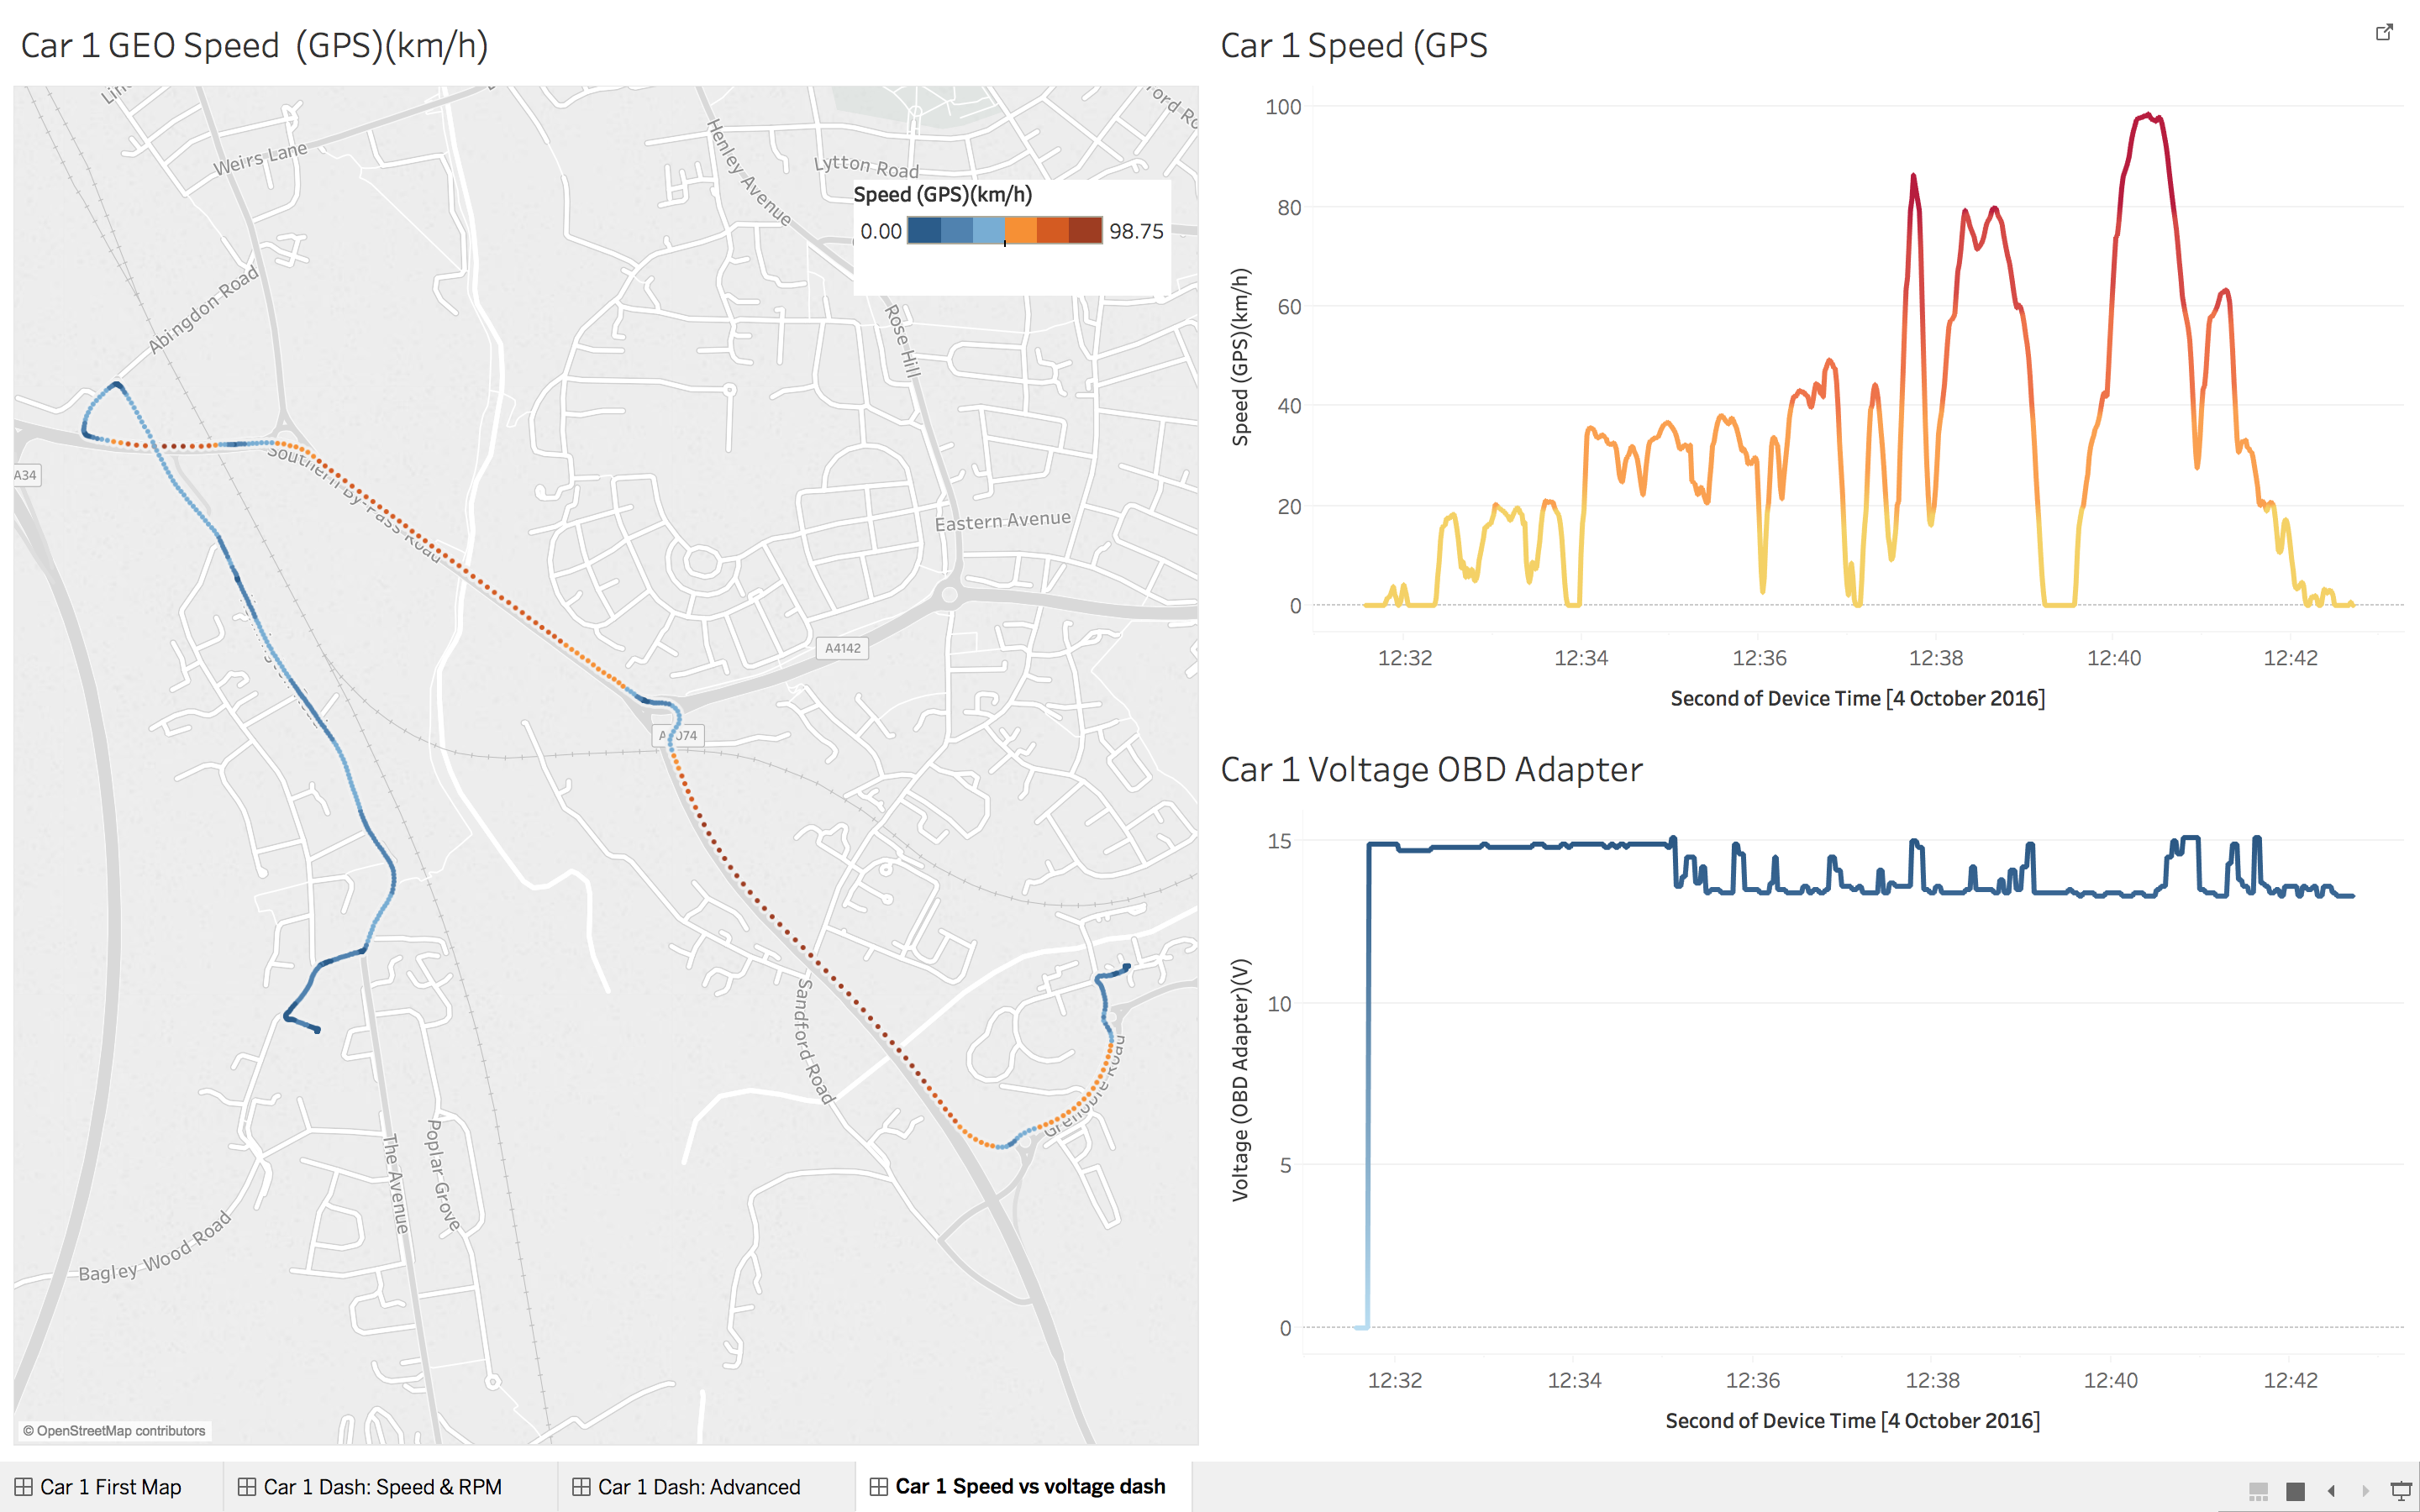
Below are some of the initial Visualizations and Dashboards created for HEADING ON using Tableau 10 Desktop.
PLEASE NOTE: All details of the data analysis cannot be shared publicly at this stage.
These data sets are not for public use and as such no interactive workbooks can be shared currently.
PHASE 1: INITIAL EXPLORATORY DATA ANALYSIS
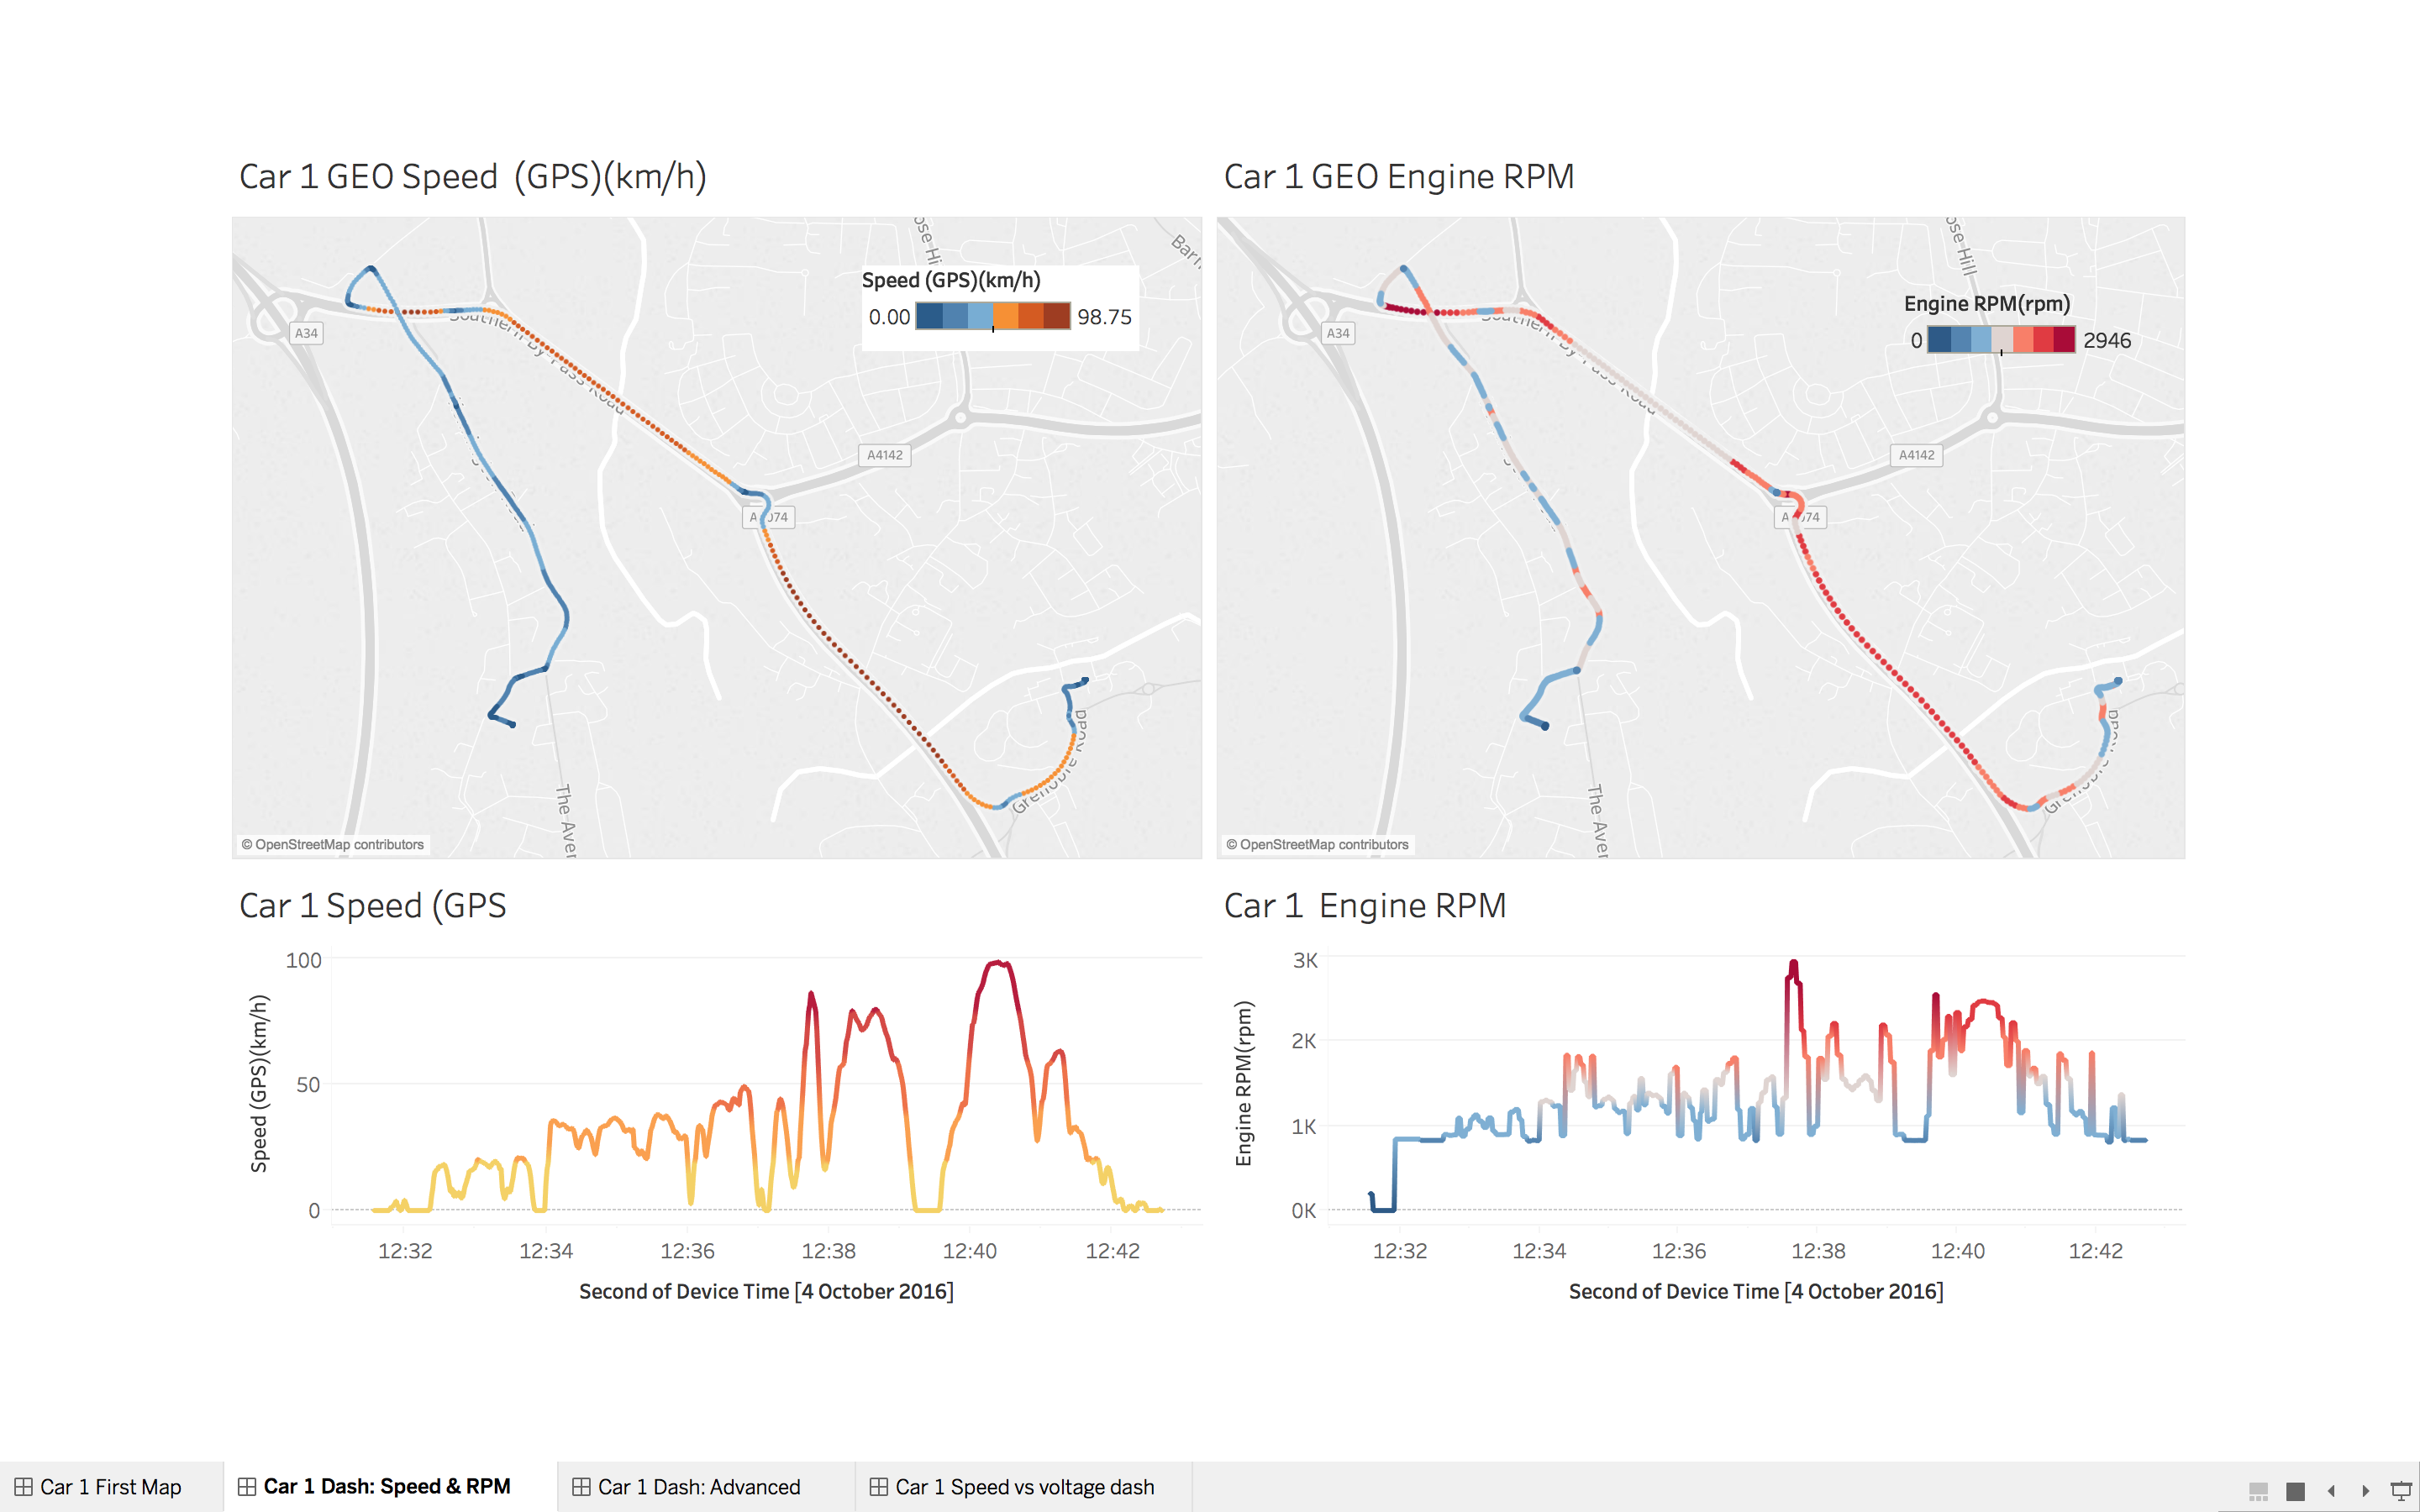
For Phase 1 of the Analysis the focus was to explore the data provided and gain some insights into how this data could used for HEADING ON’s Key strategy. The dashboards created were exploring different ways in which the data could be displayed and to identify important metrics worth exploring in more detail.
PHASE 2: 3 JOURNEY TEST DASHBOARDS
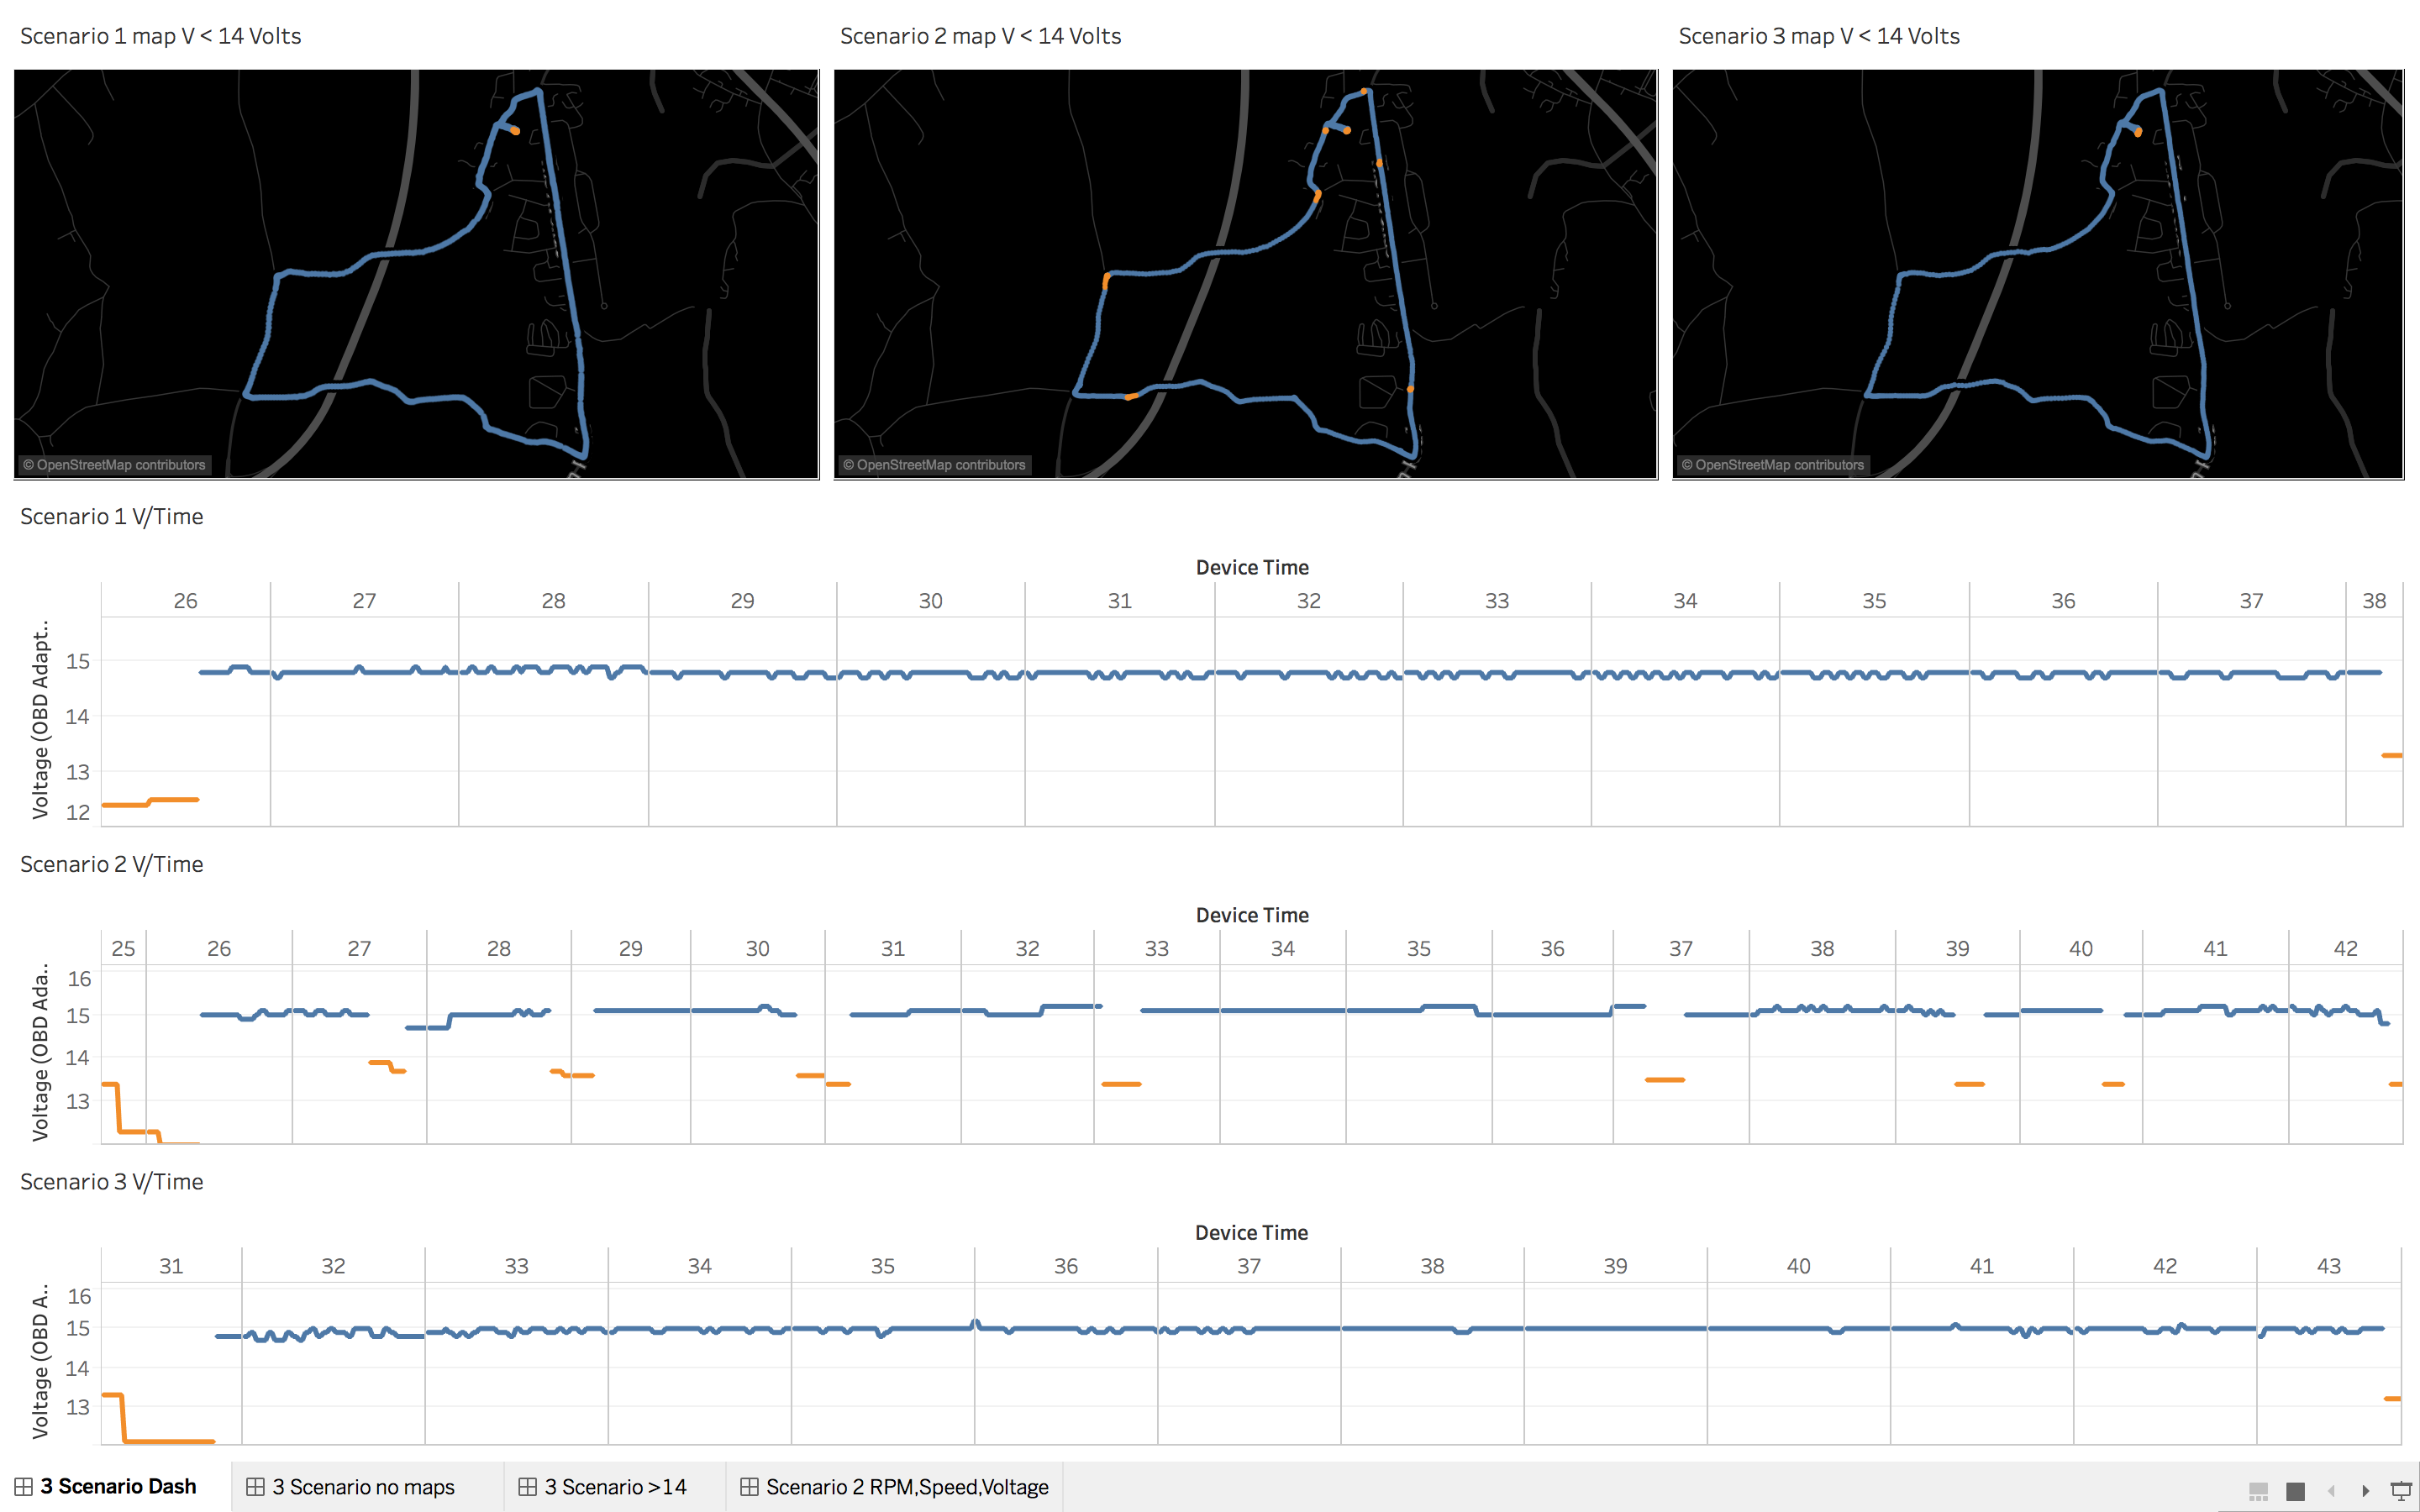
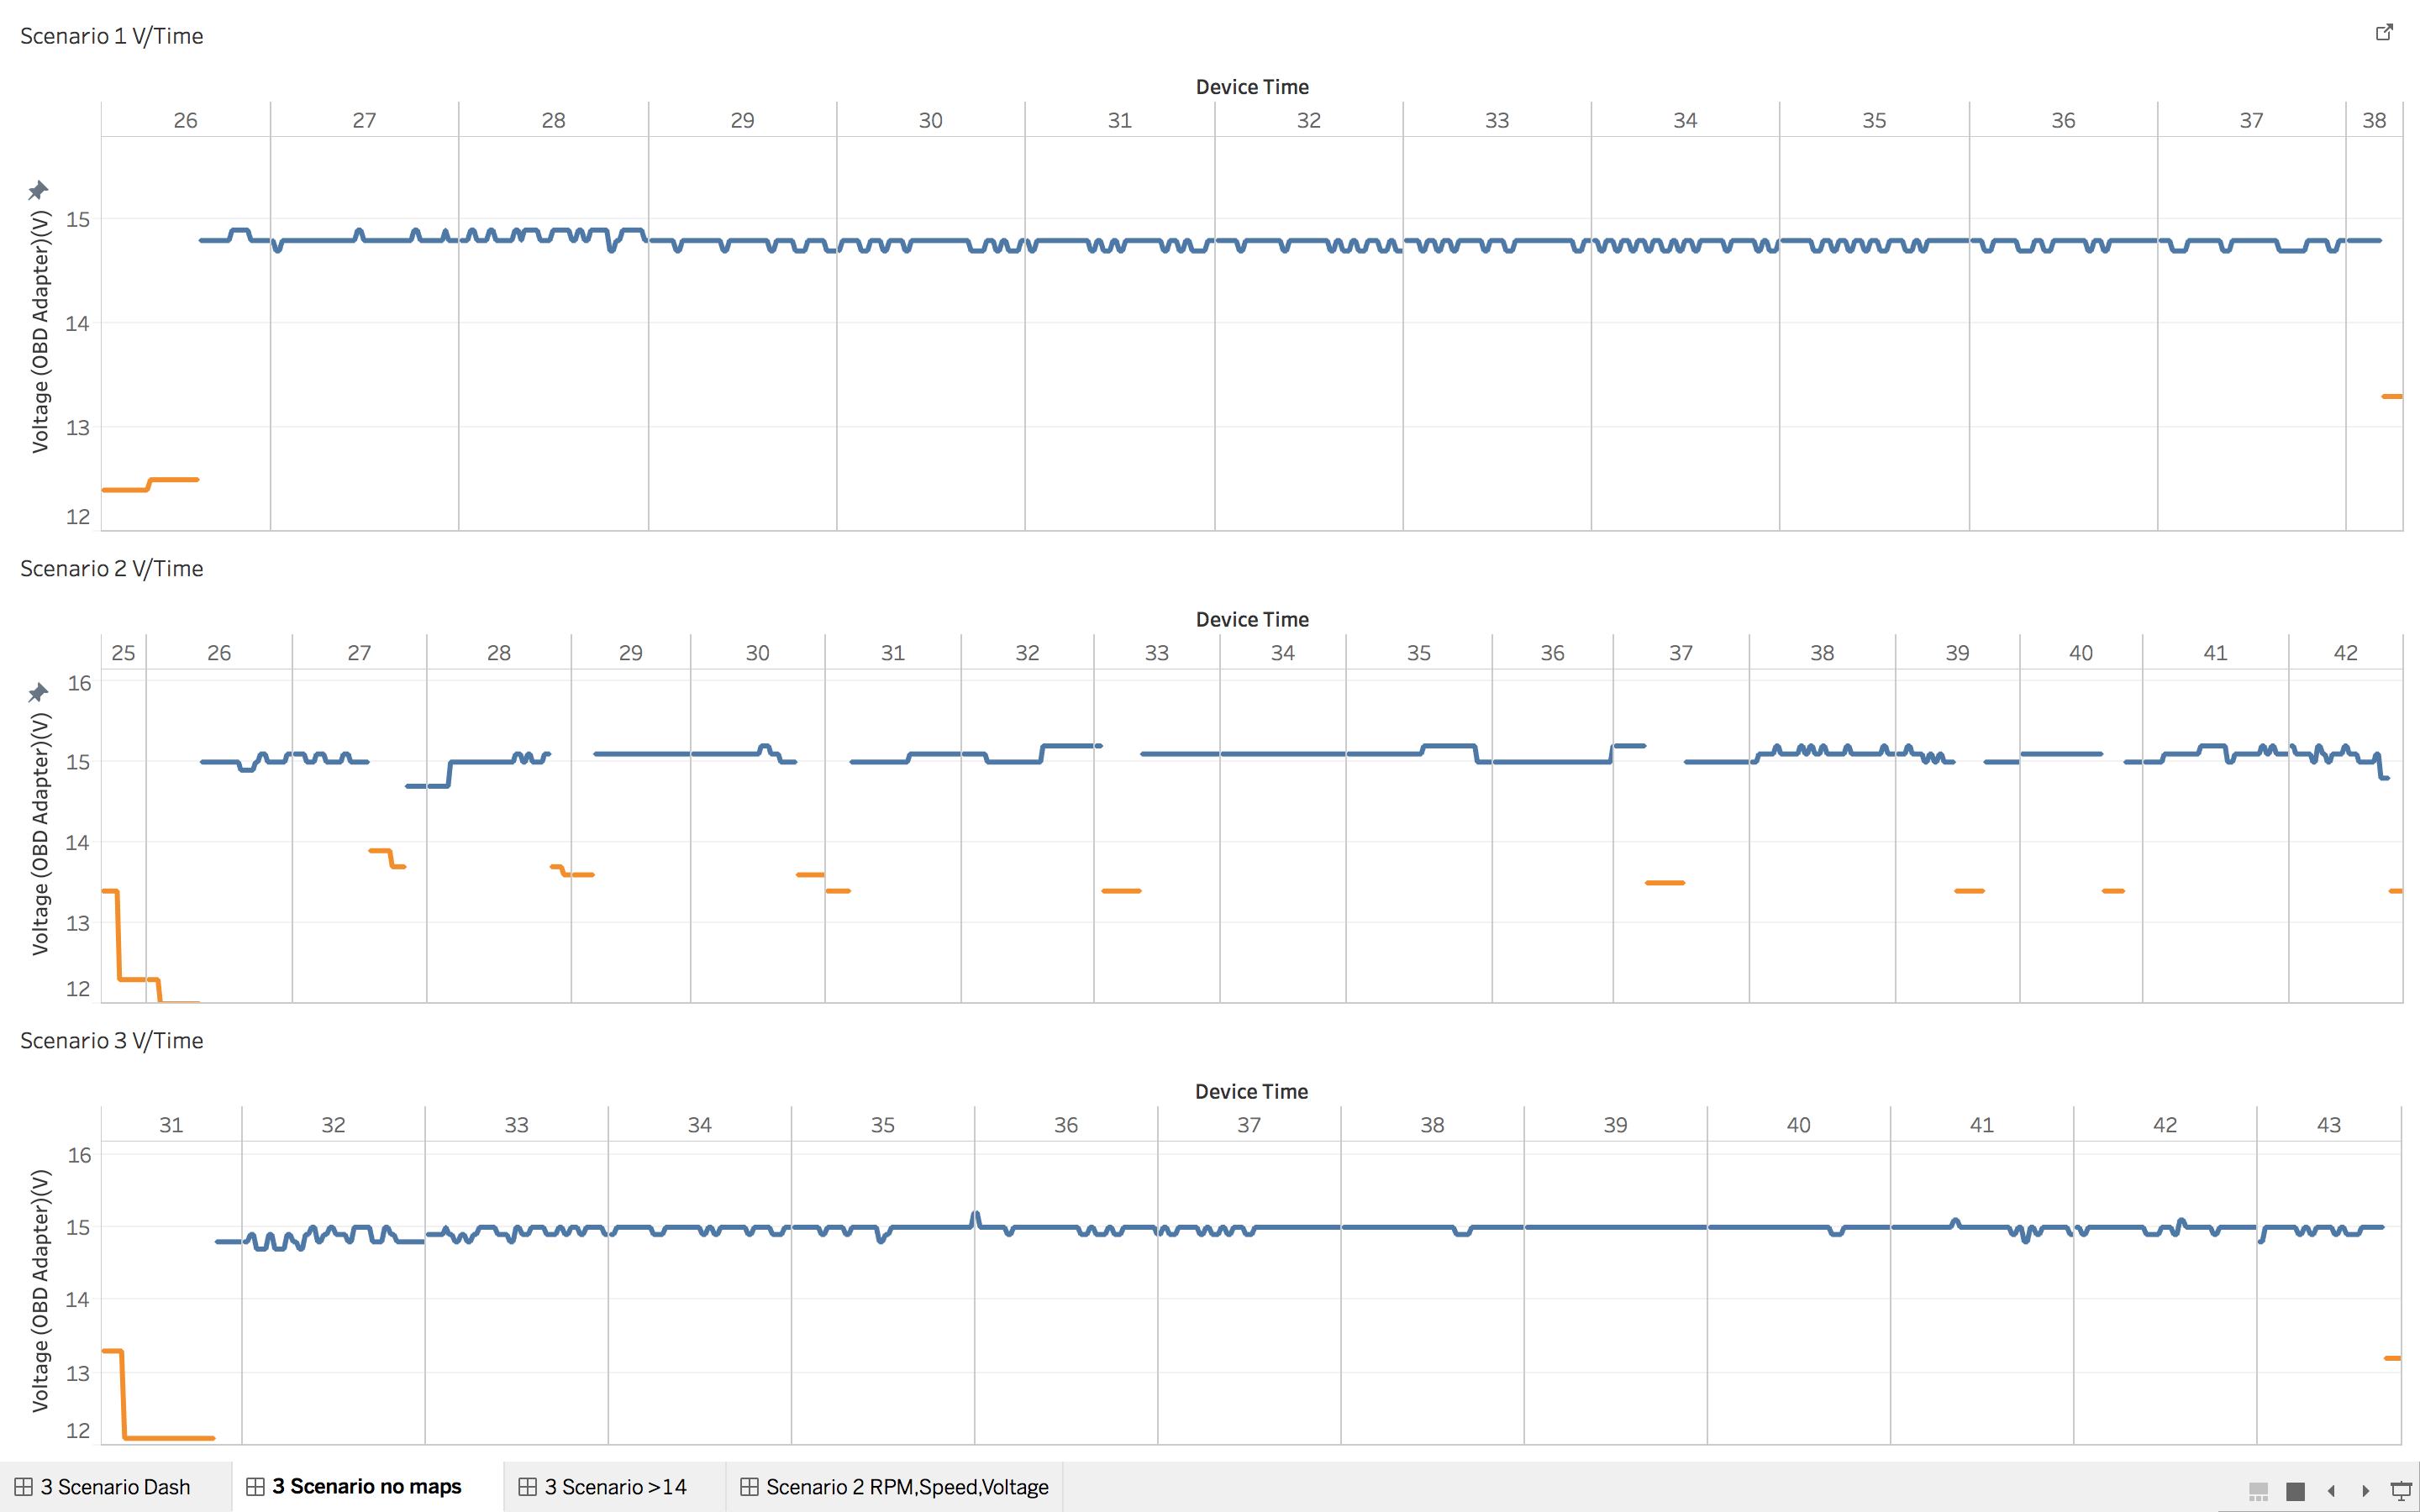
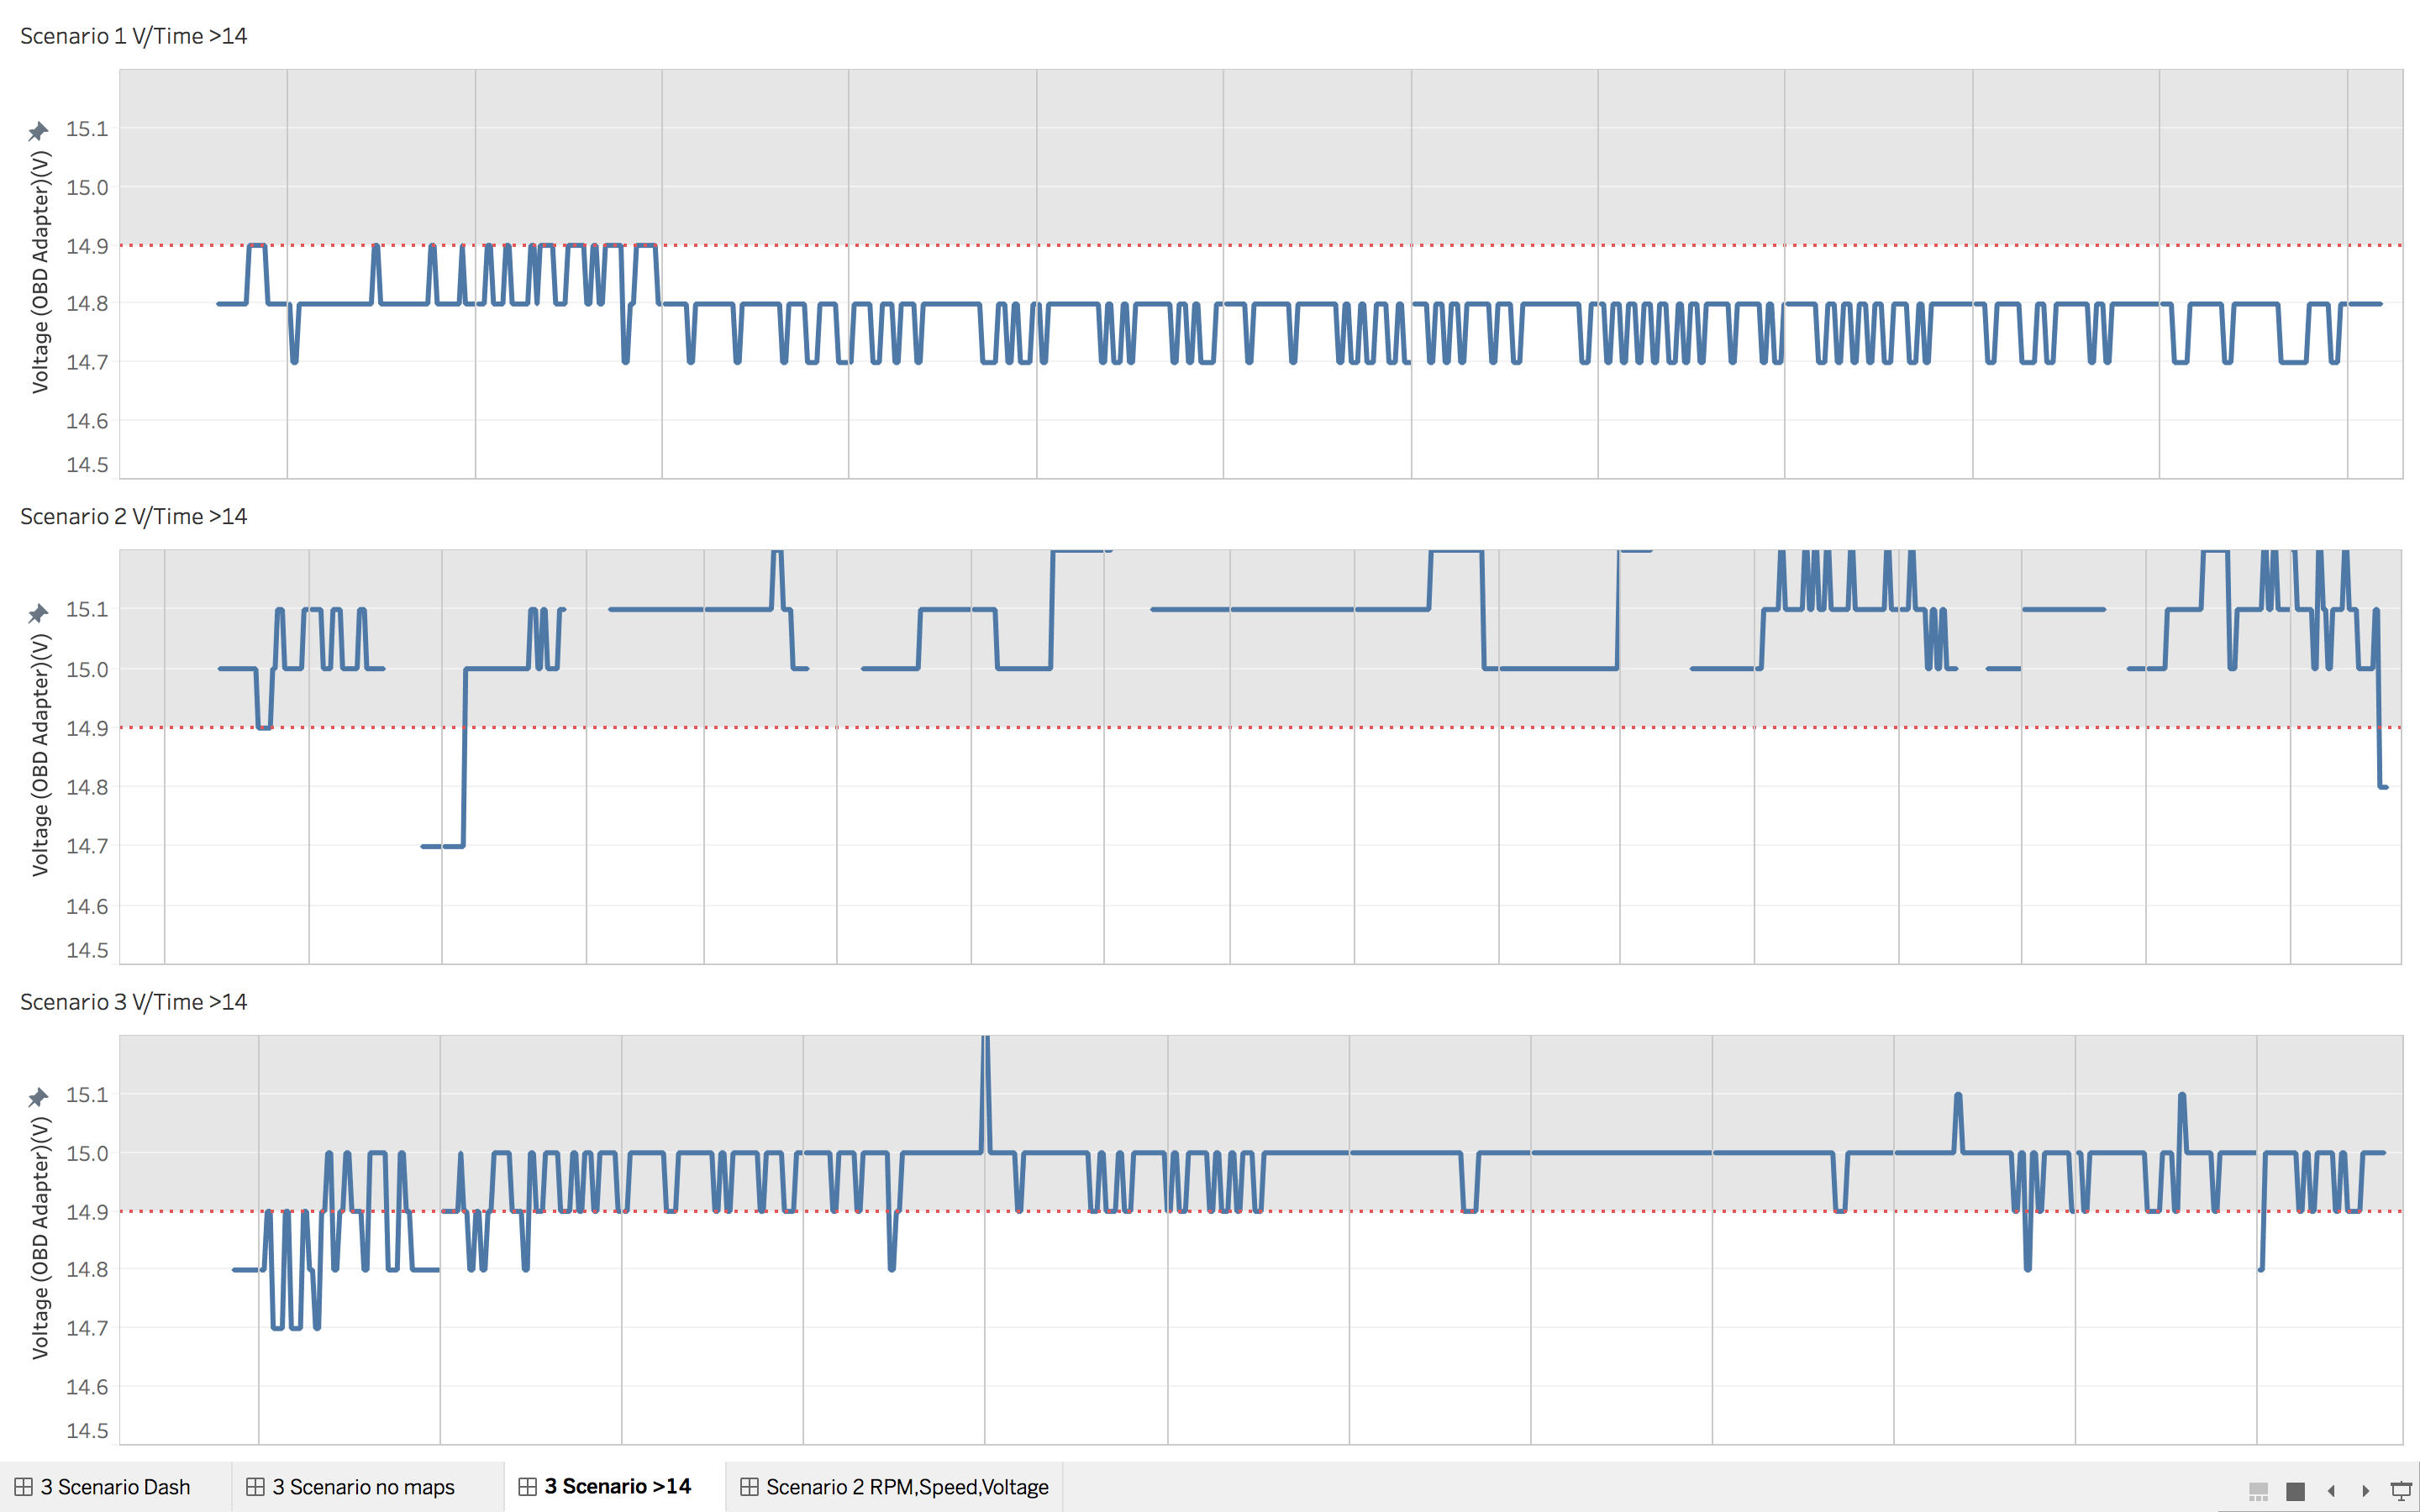
After the initial Analysis Phase we had a clearer indication of how the data could be visualized to provide insight. We also identified a key metric to explore further which correlated to information received when speaking to domain experts.
The result was the creation of the 3 Journey Test Dashboards in order analyse vehicle data of three specific journeys.
This analysis provided clear supportive evidence for a specific use case for HEADING ON’s main strategy and goal.